Store your photos and videos online with secure storage from Photobucket. Available on iOS, Android and desktop. Securely backup your memories and sign up today!
The graph could be correct if all of your wagers were on the same day. The vertical line represents your highs and lows for that day. The graph always looks strange for the first few weeks because it uses the date as the horizontal axis and multiple wagers in a day result in vertical spikes.
Be sure to input the date you placed each bet into the Bets sheet to make the graph work. If you continue to experience difficulties send me a PM.
With your graph it looks like you may have bets listed out of chronological order. The reason I say this is because of the horizontal lines going back and forth between dates. My suggestion is you enter the date that you placed the wager rather than the event date. This prevents the back and forth lines you have above.
Try reordering your bets in the Bets worksheet so that your 1-Aug-14 bets are listed first, followed by the 2nd of August bets, etc. This should result in a graph that makes more sense.
Unfortunately, putting in the bets according to their event date is really a necessity for me. Which means I will probably have to reorder the list manually after every day or so.
Which brings me to my next question. Is there something like eventHandlers within Excel(VBA)? This way a callback function would be called, which automatically reorders my list after every new line in the "Bets" sheet.
Other than that, I can't really think of any other way of doing this. Any suggestions?
Yep, the graph looks good now. The spikes on the 2nd and 3rd of August indicate the highs and lows for the day.
You should be able to get the job done using the Data -> Sort function. It would probably be easier than writing VBA code, although the coding approach would be convenient once you have it set up.
Another approach would be to add a second date column to the Bets worksheet that contains the event date.
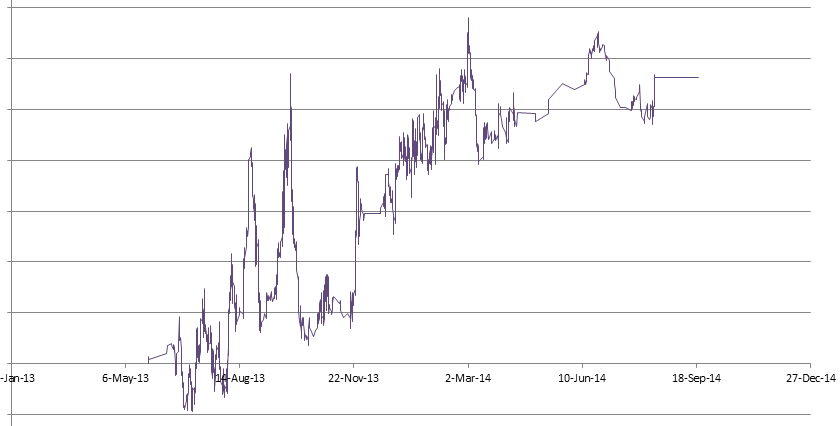
First of all, thank you for this great sheet. I've been using it for over a year now and I'm very happy with it. I have a question about the Performance Graph though. There's a lot of open space on the left side of my graph:
My first bet was on the 26th of May 2013, there's absolutely nothing before that date. How can I change the graph so that it starts on the date of my first bet instead of 4 months earlier? I want to stretch it out a little bit more (English is not my first language, but I hope you understand what I mean), because it looks like this now:
Same problem on the right side btw.
I hope somebody will be able to answer my question. Thanks in advance.
Excel automatically chooses the minimum and maximum points for the graph. For some reason it likes to leave space either side of the data. What you can do is unlock the Performance Graph sheet (using the password sport). Then right click on the horizontal axis and select Format Axis. You can then manually set the minimum and maximum bounds. These values show up as five digit numbers rather than dates, but you can find out which number to use by creating a blank cell on another spreadsheet with the value of, say "6-may-2013". You can then right click on the cell and select Format Cells and change the Number Type to General. This will then give you the number that corresponds to that date. For example, if you wanted the graph to start on the 6th of May, 2013, you would enter 41400 as the lower bound.
You could do the same for the upper bound, however you would have to update this every now and then.
I already unlocked the Perfromance Graph sheet to try and fix it myself, but despite my decent knowledge of Excel, this was a bridge too far for me. I knew that every date has a number though.
But I followed your instructions and it looks so much better now. Thank you very much for your help! Appreciate it.
Hi Great work sheet, hope you can help me my performance graph was showing profit and loss but now travels on in a straight line along the $0 line. Thanks Doug
With regards to your issue, make sure you are entering dates for all of your wagers. You can also scroll to the right in the Bets worksheet to make sure the Date and Profit columns (around AZ-BA, depending on your version) are working properly.
If you still have problems, try pasting your data into a clean copy of the spreadsheet to see if that fixes the issue.


 Tweet
Tweet


Comment